

 Calculate Revenue
 Research Markets
 Find For Sale Properties
 Compare My Listing
 STR Revenue Calculator
 Custom Comp Sets
 Submarket Insights
 Custom Search Filters
 Rate Recommendations
 Performance Benchmarking
 Competitor Comparison
 Owner Contact Details
 Property-level performance data
 Tourism Insights
 Real Estate Investment Analytics
 About Us
 Sales
 Support
 Press
U.S. Review July 2026: World Cup Boost Gives Way to Broader Rate Growth
Published: August 13, 2026

Bram Gallagher
Key Takeaways:
- U.S. short-term rental performance strengthened in July, with RevPAR up 7.2% YoY, ADR up 6.9%, and occupancy up 0.3%.
- World Cup host cities continued to see strong pricing gains, but ADR growth broadened across the market, with 49 of the top 50 markets recording increases.
- Demand pacing remains strong for the second half of 2026, while high mortgage rates continue to limit new STR supply growth.
Geopolitics couldn’t dissuade holidaymakers in the U.S. in July. While soccer fans certainly led the way, giving World Cup host cities an enormous and enduring boost even as the games wrapped up, ADR was up almost everywhere, and by large amounts. Some of this increase was helped by a slight rise in occupancy (+0.3%), but perhaps the biggest contributor was the exceptionally weak rate growth in July last year, at just 1.1%. In fact, H2 2025 was weak in its entirety, with rates even declining in August and September, so we may have a few more months of sizable rate gains ahead of us.
Pacing data reflects this upward momentum in demand growth, with each month after August pacing more than 15% ahead of last year. While that is unlikely to translate directly into the eventual demand growth figure, the outlook for the rest of the year is positive. Pricing, demand, occupancy, and even lead times are all trending upward, with lead times finally breaking out of a years-long stretch of near-continuous decline.
The only metric on the downward ebb appears to be supply, which continues to be hampered by high mortgage rates without any immediate sign of improvement. What’s bad for the new entrant may be good for the incumbent, however, as fewer new competitors should continue to contribute to the unit-level performance gains observed in July.
At a Glance: Key U.S. STR Performance Metrics for July 2026
- Revenue per Available Rental (RevPAR) increased 7.2% year-over-year (YoY) to $217.17
- Available listings reached 1.75 million, a 2.6% increase YoY
- Demand nights were up 2.0%
- Occupancy averaged 68.4%, up 0.3% YoY
- Average Daily Rates (ADR) climbed to $317.55, up 6.9% from last year
- The Repeat Rent Index (RRI) rose 8.1% YoY
- Total nights booked were up 6.9% from 2025
Economic Outlook
Monetary conditions continued to tighten in July as the Federal Reserve declined to change its target for short-term interest rates amid inflation concerns. Rates for 30-year fixed-rate mortgages increased 23 basis points over the course of the month, from 6.43% in the first week to 6.65% by the end of the month. While AirDNA initially expected rates to slowly decline throughout 2026 to around or below 6%, they have instead marched higher since the beginning of the war on Iran in late February, reducing the affordability of new mortgage debt and keeping the U.S. housing market in a continued deep freeze. The effect on short-term rental markets has been that supply growth has not accelerated as expected, but rather flattened to about 2.5% in 2026.
On the other hand, new rate hikes have most likely been staved off for now, as the July jobs report indicated that the labor market is not in danger of overheating. The U.S. lost 23,000 jobs in July, according to the Bureau of Labor Statistics. Moreover, the blockbuster June jobs number was revised sharply lower, by 66,000 jobs. The unemployment rate declined slightly to 4.1% from 4.2% in June; however, this drop was driven entirely by a reduction in the labor force participation rate, which tracks the portion of the population engaged in the labor market. The participation rate fell to 61.4%, down from 61.5% in June. Over the year, the rate dropped 100 basis points, from 62.4% at the end of 2025. This is the fastest slide in the participation rate since the Great Recession, excluding the pandemic.
Since rate hikes generally cool the labor market and lower inflation, a weak jobs report decreases the motivation for a near-term hike, especially since inflation cooled significantly, from 4.2% in May to 3.5% in June. Although some additional inflation is expected as a result of new hostilities with Iran driving up oil prices, as well as new tariffs being announced, the balance of sentiment seems to favor leaving rate targets where they are. Still, the trend in mortgage rates leaves little upside risk to short-term rental supply.
Listing Growth Flattens, Kept Up by World Cup Markets
Listing growth has generally declined since the Federal Reserve began hiking interest rates in March 2022. In response to both declining unit-level performance and the higher cost of purchasing homes to let, the total supply of listings grew at an ever-decreasing pace until hitting a low in September 2025. Mortgage rates began a steep decline in H2 2025, which AirDNA expected would eventually contribute to higher listing growth in 2026. Historical evidence suggests a five- to six-month lag between changes in interest rates and changes in the number of new STR listings.
Since February, however, mortgage rates have returned to previous highs and remain on an upward trajectory. Available listing growth has stayed at or below 2.6% since February, including in July (+2.6%). Although this is a historically low growth rate for the U.S. STR market, evidence suggests that growth may slow even further in the coming months.
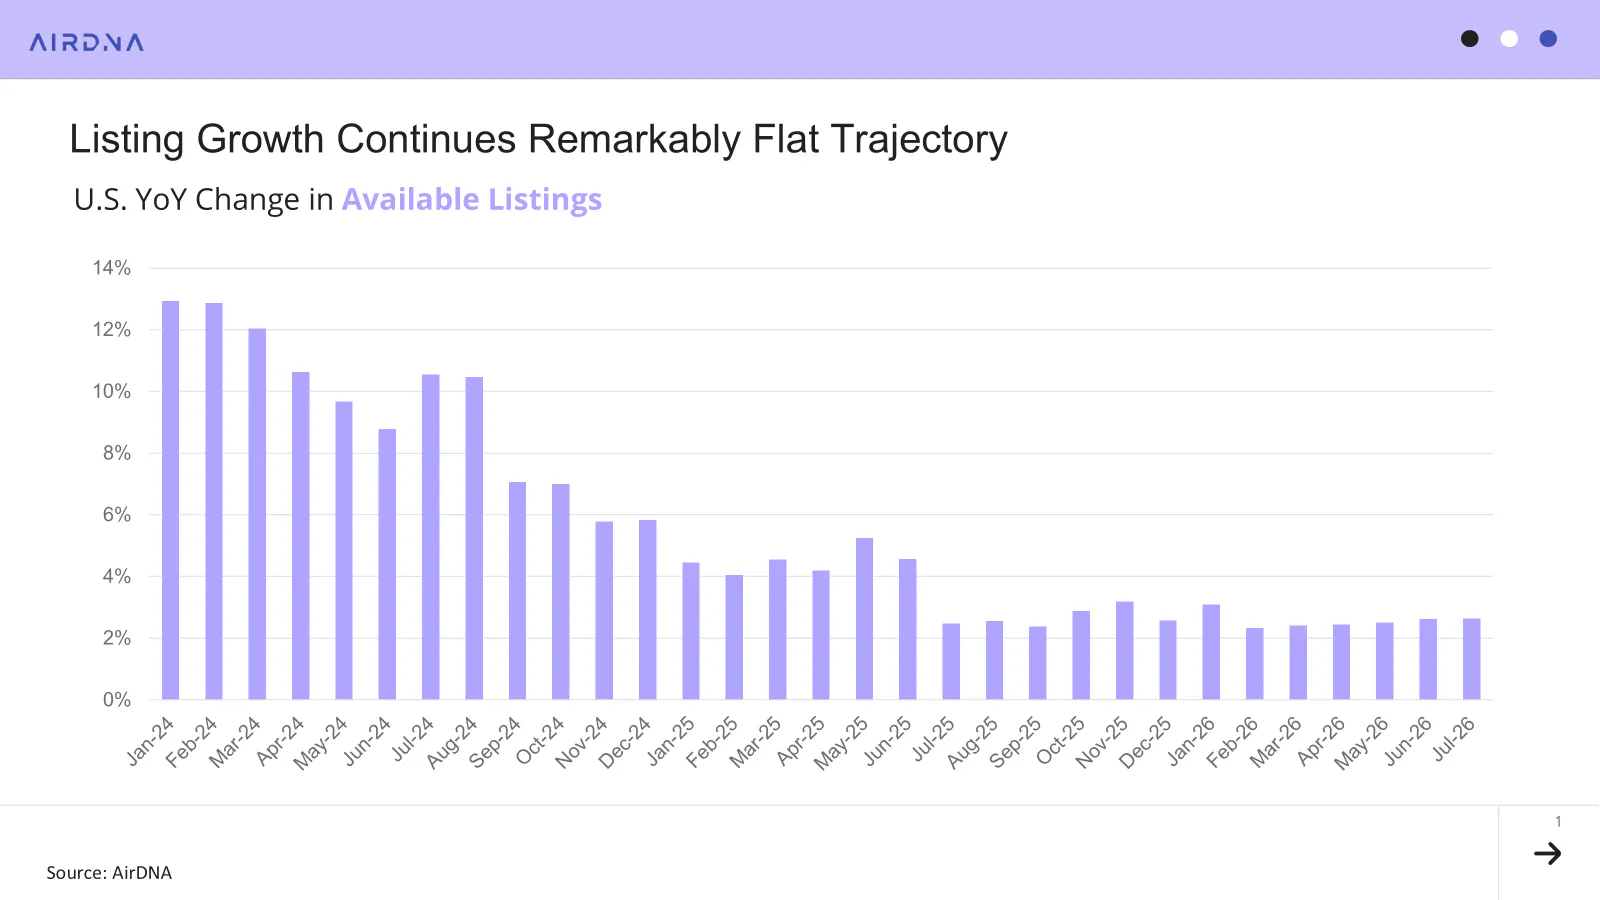
Since rates have a five- to six-month lag before showing up in new listing growth data, some of the effect of lower rates in H2 2025 and January 2026 is still being felt. These effects should fade in H2 2026.
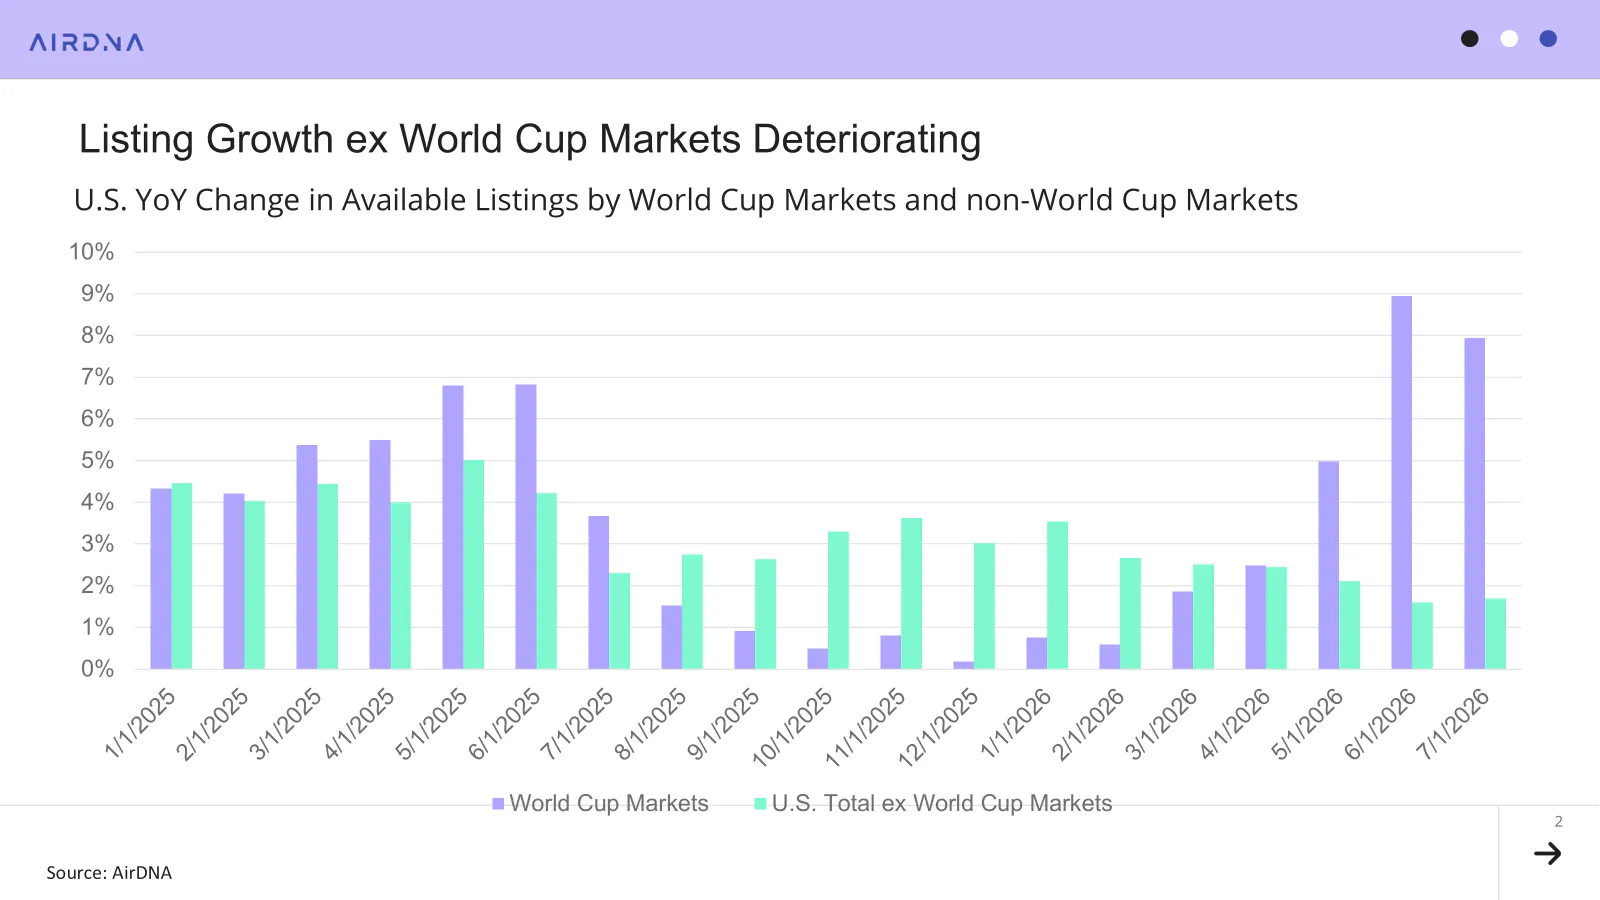
Another factor that has contributed to higher listing growth in 2026 is the build-out for World Cup markets. Breaking out these markets from the rest of the country reveals that World Cup host markets detracted from listing growth until about April 2026. After that, the same markets strongly contributed to higher listing growth. The rest of the U.S., however, has seen decelerating rather than steady growth since February, with growth falling below 2% in both June and July.
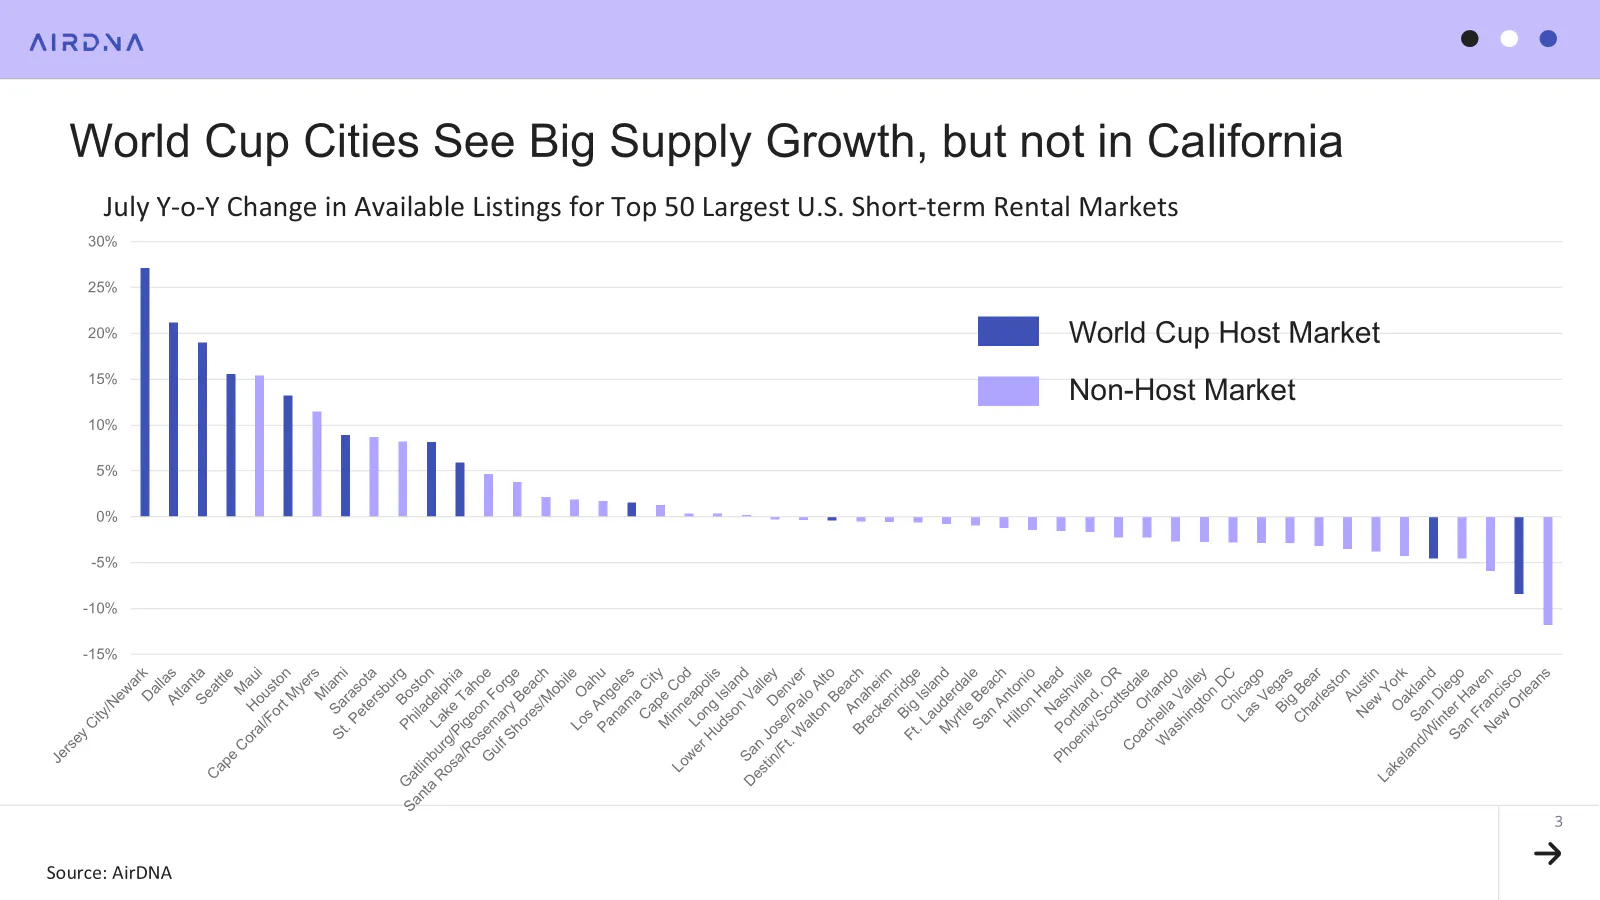
Turning to markets, the outsize influence of World Cup cities is apparent, as 8 of the top 12 markets for supply growth were host cities. The importance of regulation, even in the face of a major international event, is apparent as well, with Los Angeles the only California market to see even a small increase in available listings (+1.6%).
San Francisco (-8.4%) had the second-largest drop in listings among the top 50 markets, despite its proximity to the Santa Clara World Cup venue. The largest drop occurred in New Orleans (-11.8%), which increased enforcement of regulations shortly after hosting the Super Bowl in 2025.
Demand Spurs Occupancy to Small Gain
While listing growth kept a steady pace, demand growth dropped to a standstill in February and has made a small recovery since. Examining the trailing 12-month average for monthly demand, a noticeable shift in the trajectory appears in September 2025, with the curve becoming much flatter. However, after the pause in February, demand growth has established a strengthening trajectory.
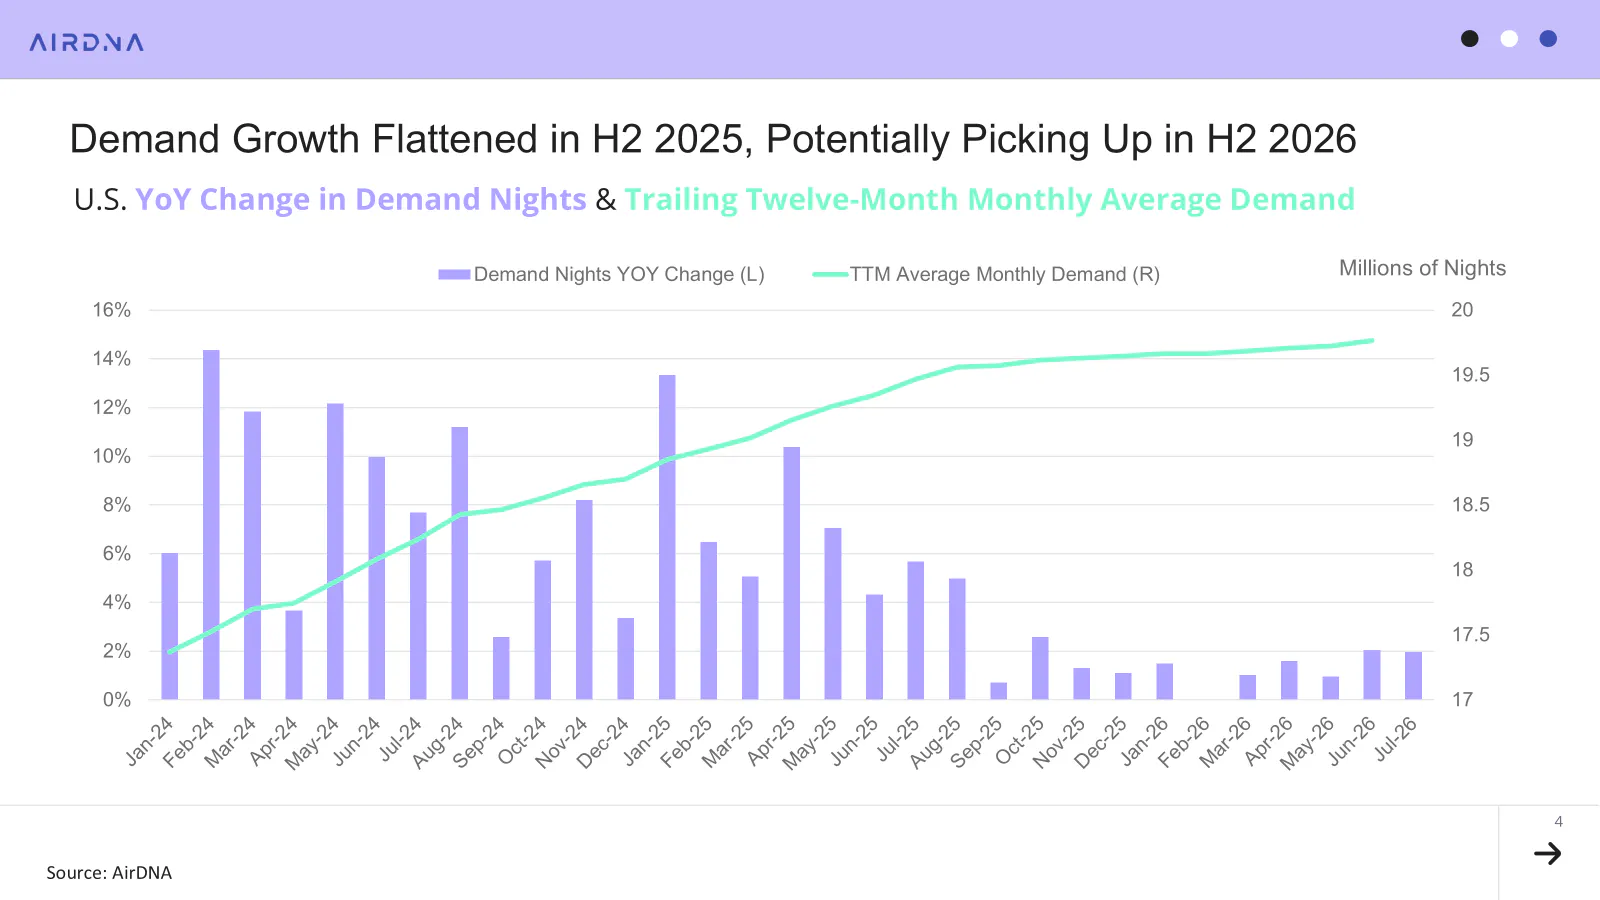
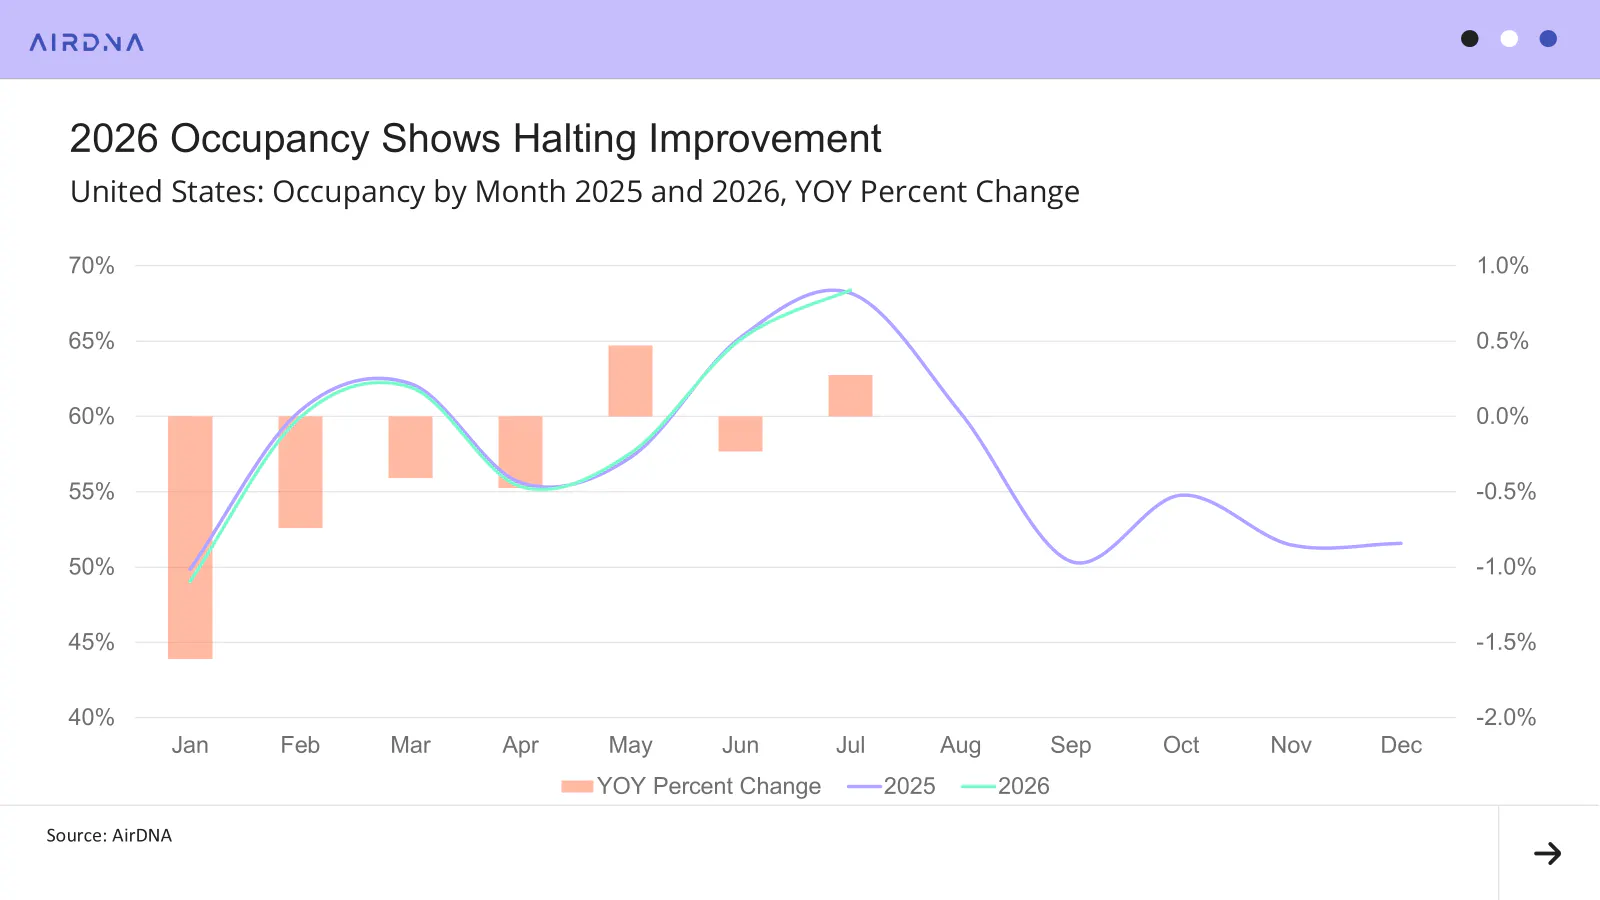
With demand growth strengthening and listing growth stalling, the occupancy trend in 2026 has been one of accelerating growth, although with some starts and stops. The first seven months of 2026 saw nearly identical occupancy to 2025, with the year beginning slightly lower and ending July slightly higher (+0.3%). On an aggregate year-to-date basis, 2026 occupancy is 0.3% lower than in the first seven months of 2025.
The rest of 2025, with the exception of August, saw much lower growth, creating easier comps for the remainder of 2026. Combined with steady or falling supply growth, AirDNA expects 2026 occupancy to end the year slightly higher than in 2025.
ADR Leaps Up at Fastest Pace Since August 2024
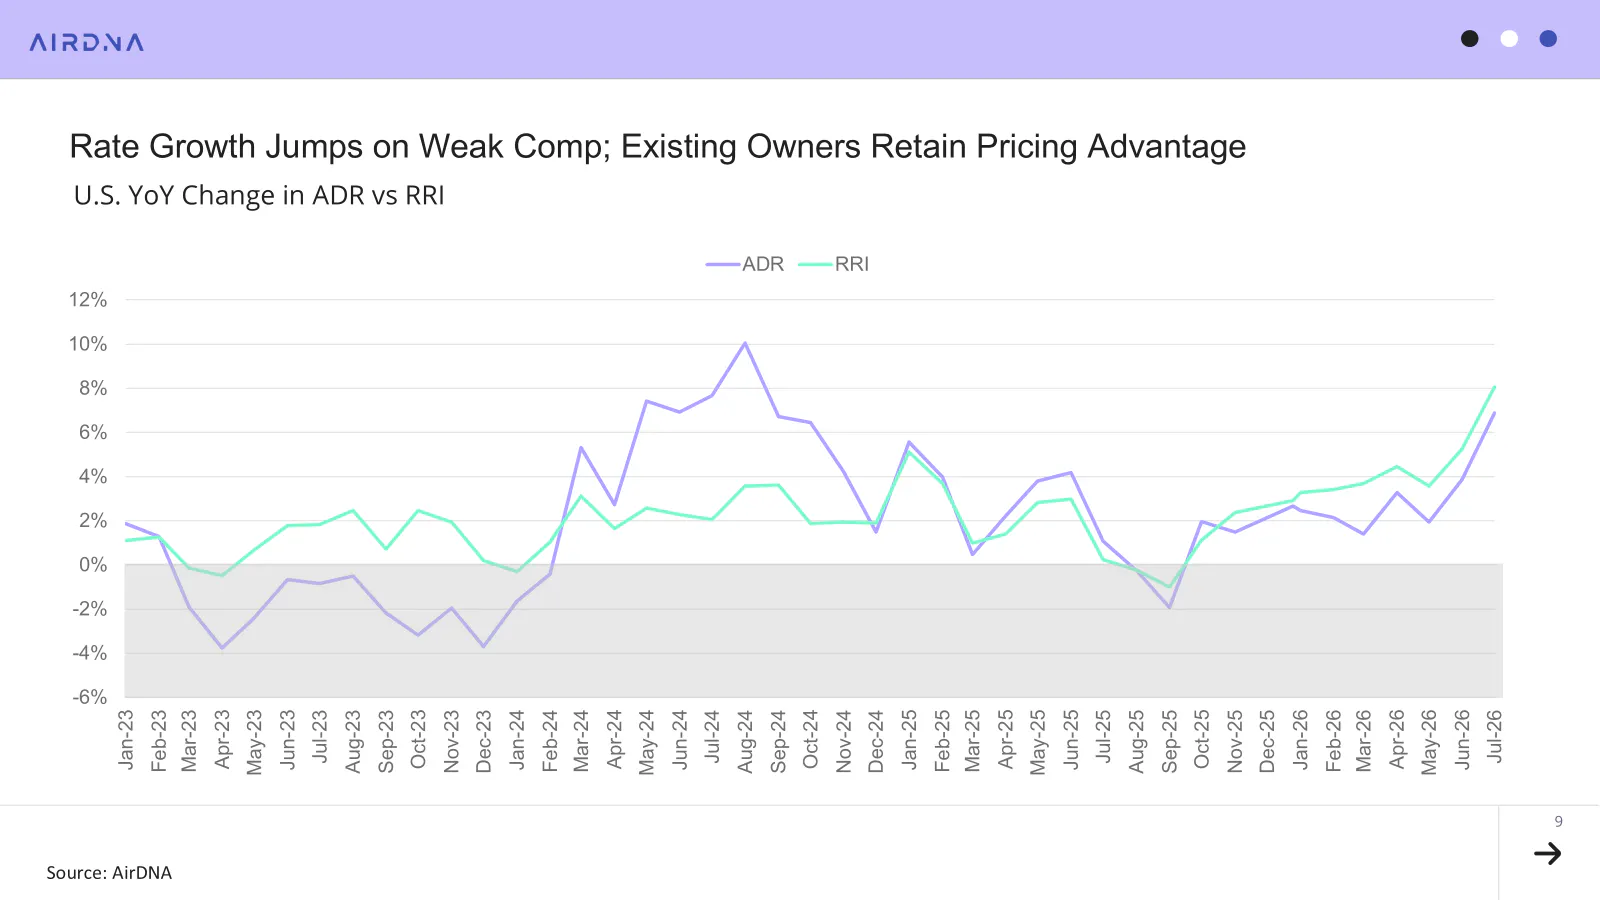
Average daily rate growth had been tracing a zig-zag path around 2% in 2026, but saw sharp upturns in June (+3.9%) and July (+6.9%). In fact, July’s growth rate was the fastest seen since August 2024.
Throughout the year, existing operators have also seen better pricing power than the market as a whole, according to the AirDNA Repeat Rent Index (RRI), an index of prices that excludes the effect of changes in the composition of STRs within a market. This previously occurred in 2023 during a period of high inflation, likely as new entrants kept guests’ preference for value in mind.
During times of economic uncertainty, existing operators also have an advantage in their review histories, as testimonials from previous guests can help alleviate concerns about uncertain quality. As inflation eases over the next year, these growth rates should move closer together, or even reverse positions as new listings shift their focus from value toward novel guest experiences.
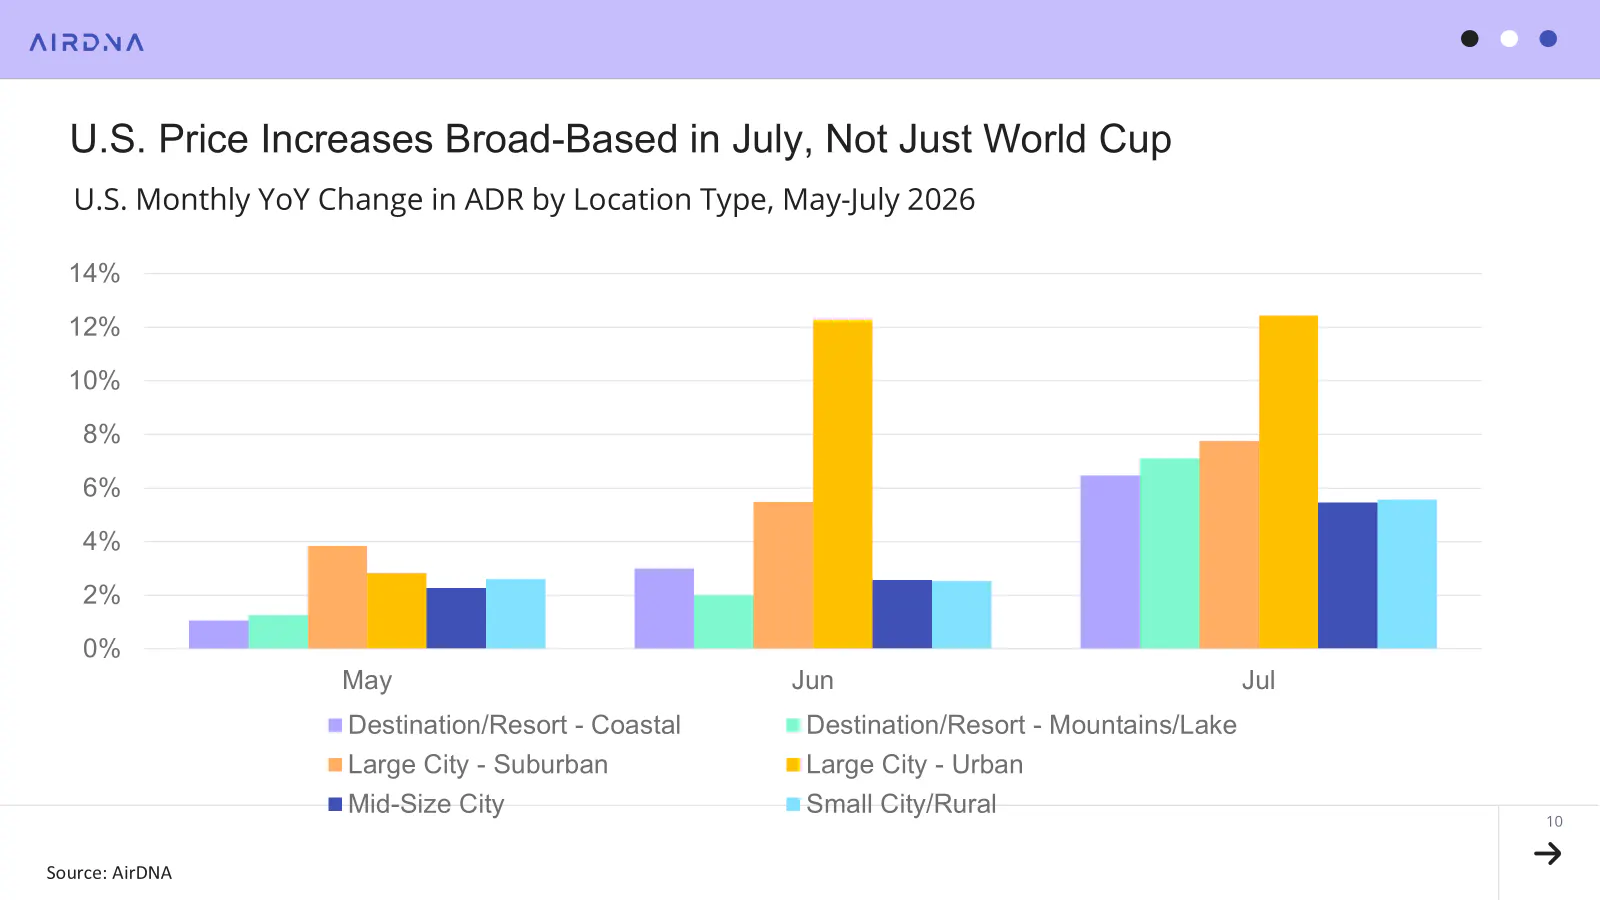
The natural conclusion to draw from these numbers is that the World Cup boosted prices in some markets so much that the national average increased. This was largely true in June, when Large City Urban and Suburban locations saw price increases much larger than other location types.
However, ADR growth in July accelerated sharply across all location types. While World Cup markets still led the way, improving consumer sentiment and, perhaps most importantly, a weak comparison month in July 2025 buoyed rates across all locations.
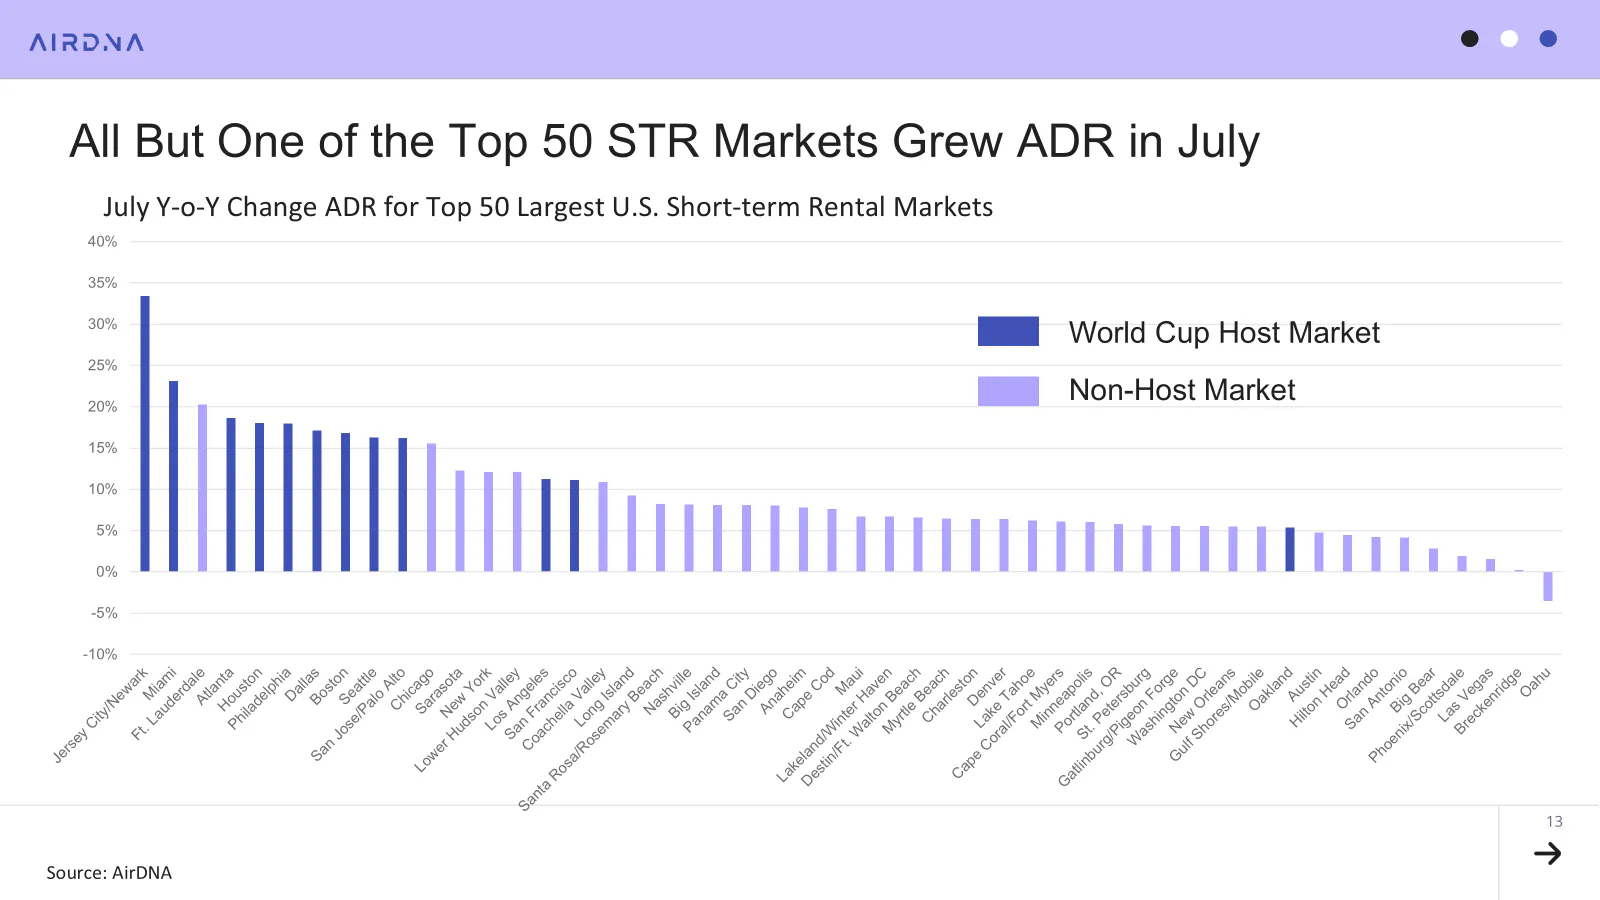
Turning to markets, the broad-based increase in prices produced ADR growth in 49 of the top 50 markets, with 41 seeing growth of more than 5%. Still, while almost all locations saw increasing ADR, the top spots were dominated by World Cup host and adjacent cities, with Fort Lauderdale (+20.3%) recording the third-highest growth.
The market serving the final match, the most expensive sporting event in history, Jersey City/Newark (+33.4%), had the highest ADR growth. Interestingly, several host cities, including Philadelphia (+18.0%), Boston (+16.8%), and Seattle (+16.3%), continued to enjoy significant year-over-year boosts to ADR despite hosting only a single game in July.
Looking Ahead as Lead Times Reverse Course
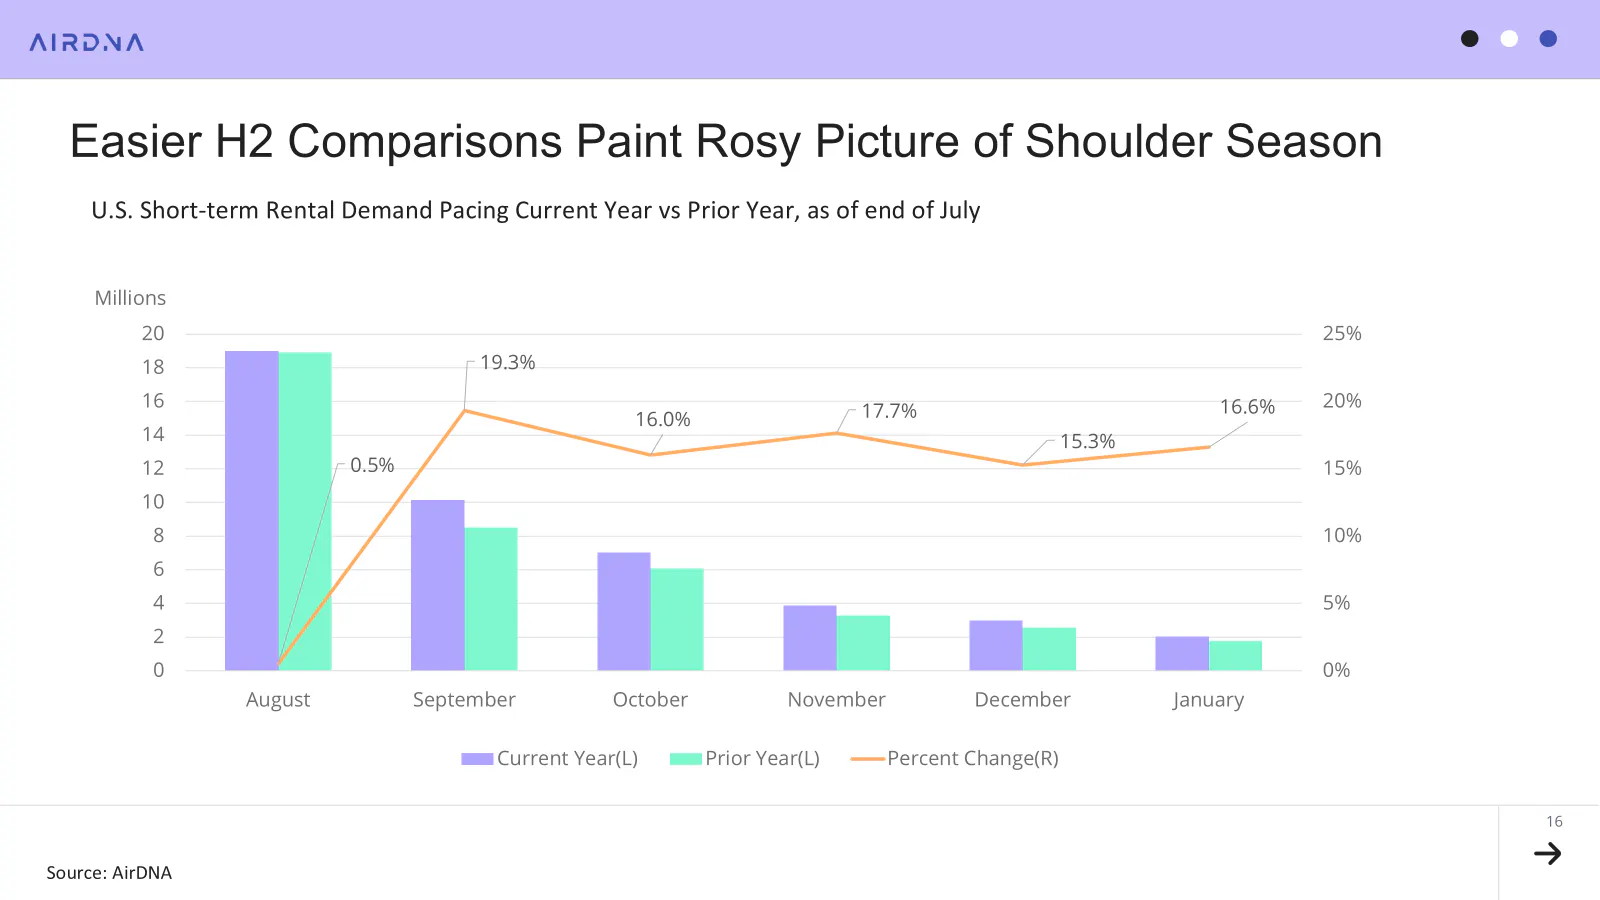
According to pacing data, which compares current on-the-books reservations with those made by the same time the previous year, the rest of 2026 looks extremely bright from a demand standpoint, with five straight months pacing more than 15% ahead after a relatively weak August.
However, two data issues add nuance to the picture. The first is a calendar shift that moved Labor Day weekend from August to September, artificially deflating August’s demand while boosting September’s. This may account for as much as 5-8% of September’s demand.
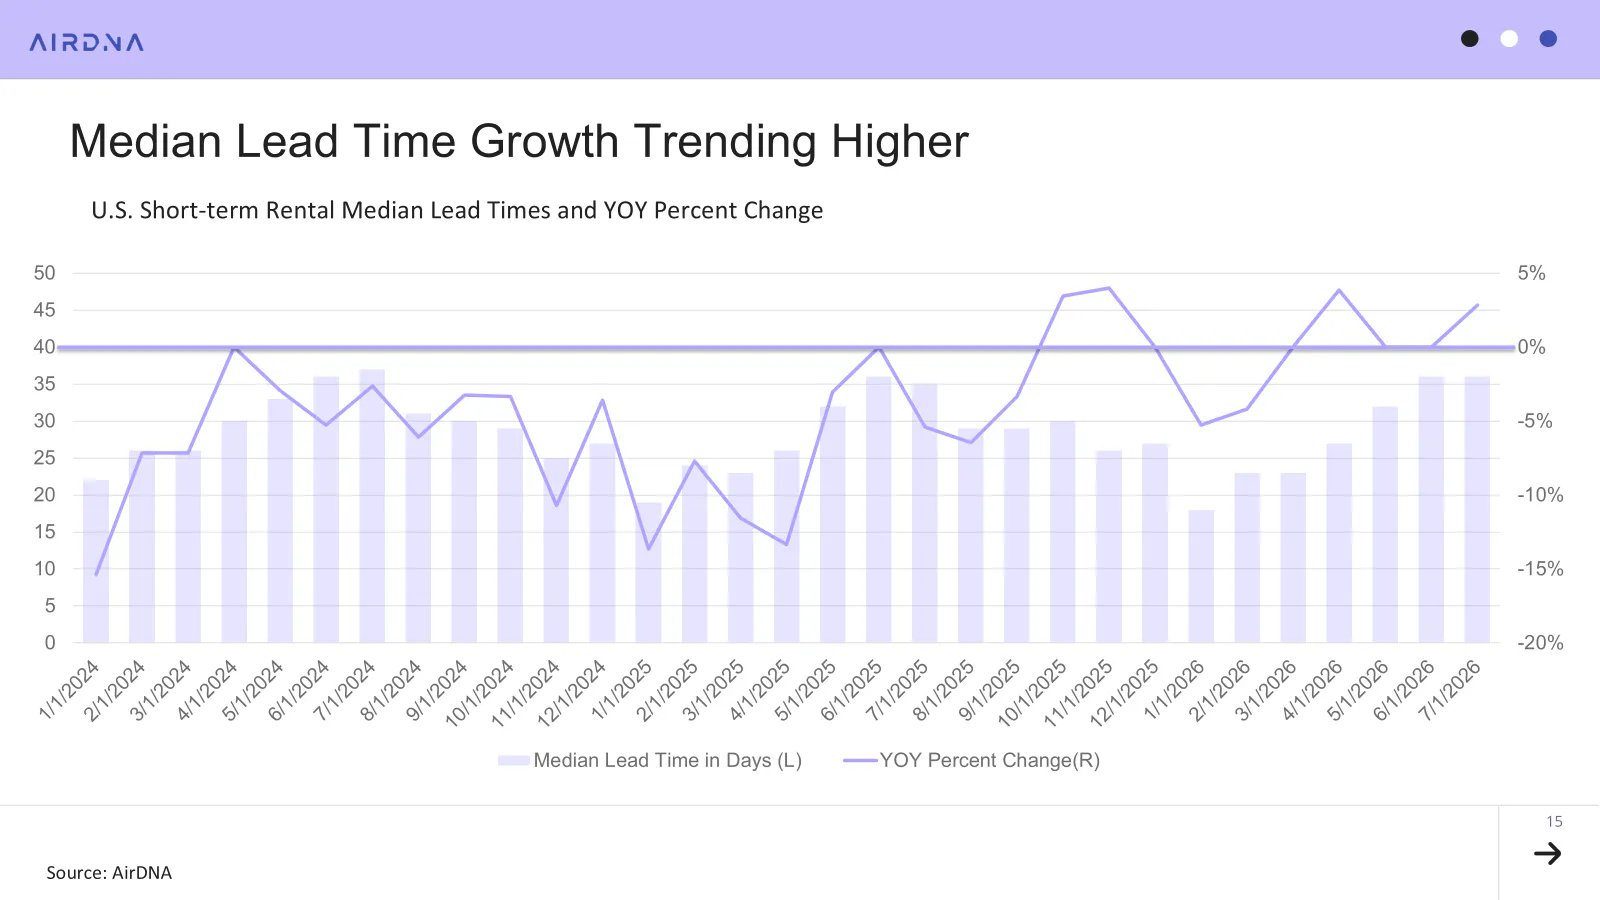
The other factor is lead time, or how many days before a reservation guests actually book their listings. Lead times had been consistently declining for several years until they increased in October and November 2025. After that, there were a few more months of decline before four months of either longer or constant lead times.
Although it’s tempting to credit June and July’s longer lead times to international travelers with long planning horizons, much of the increase comes from the Coastal Resort location type, which saw average lead times for June and July decline by an average of two days. Urban locations, on the other hand, saw lead times decline by one day in June and remain flat in July.
The upshot of higher lead times is that more reservations land earlier, which can inflate pacing figures beyond the eventual increase in realized demand. Nevertheless, the strong positive pacing figures still indicate strength for the second half of the year, and the weak comparisons of H2 2025 will certainly help, as we have already seen with ADR growth in July.
World Cup Helps International Demand Turn a Corner
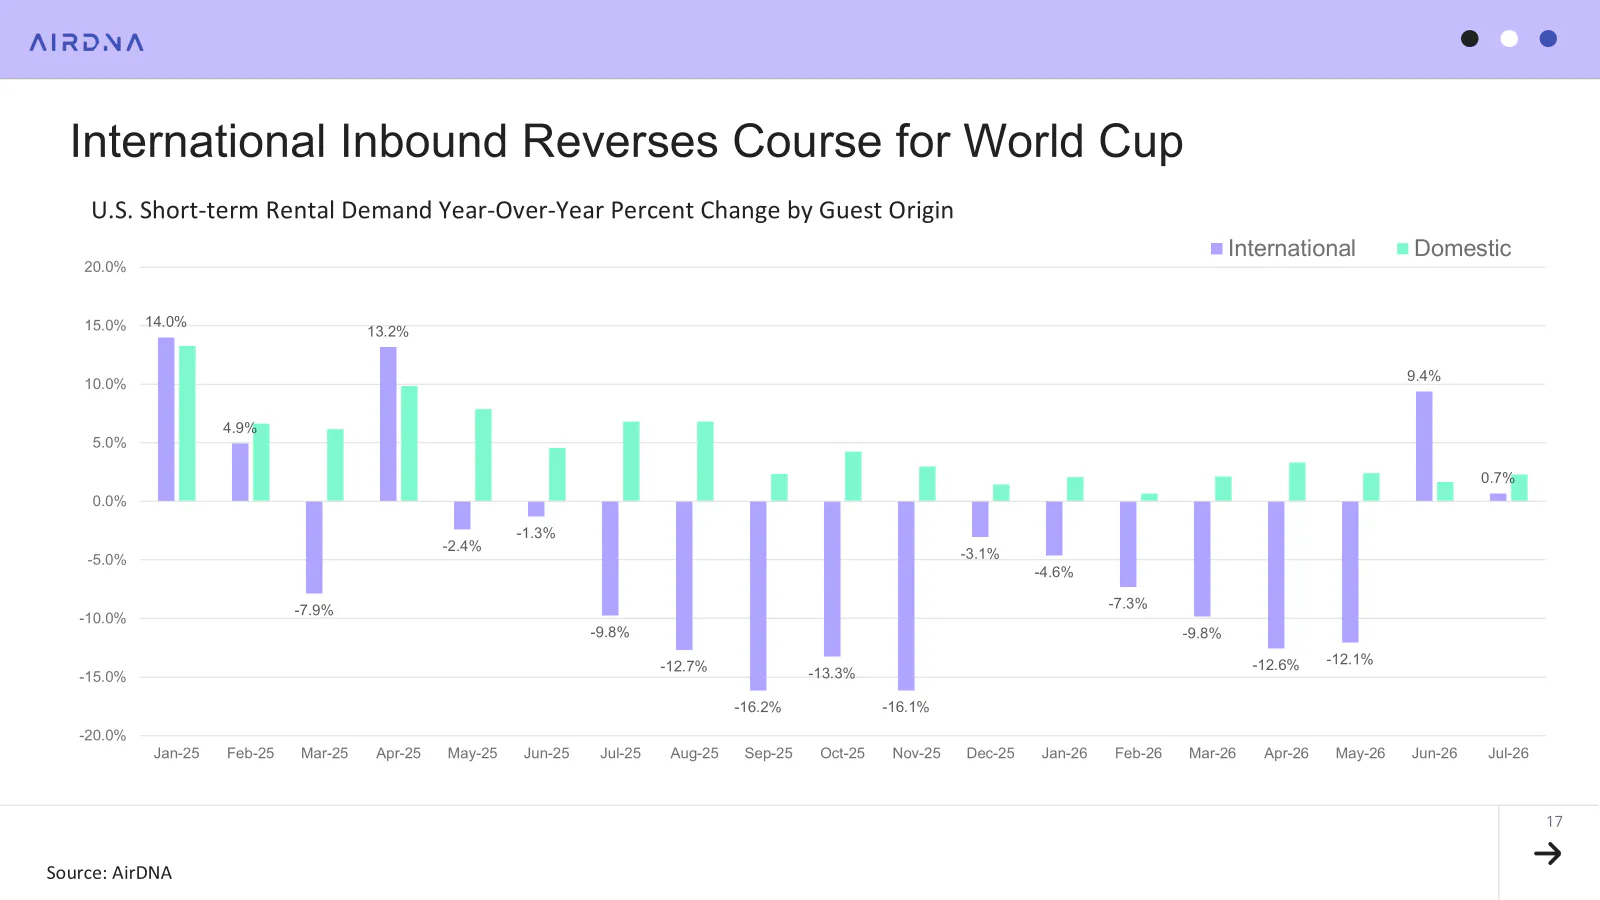
Now that the World Cup matches have concluded, guest reviews can indicate whether the international event spurred more international travel. Since May 2025, the month after the notorious “Liberation Day” tariff announcements, international sentiment has soured among some countries, especially Canada. After 13 months of YoY declines, international demand spiked significantly in June, up 9.4%. However, it seems that the group stage was the most alluring for international STR guests, as July demand was up only 0.7% YoY, following a 9.8% decline in 2025.
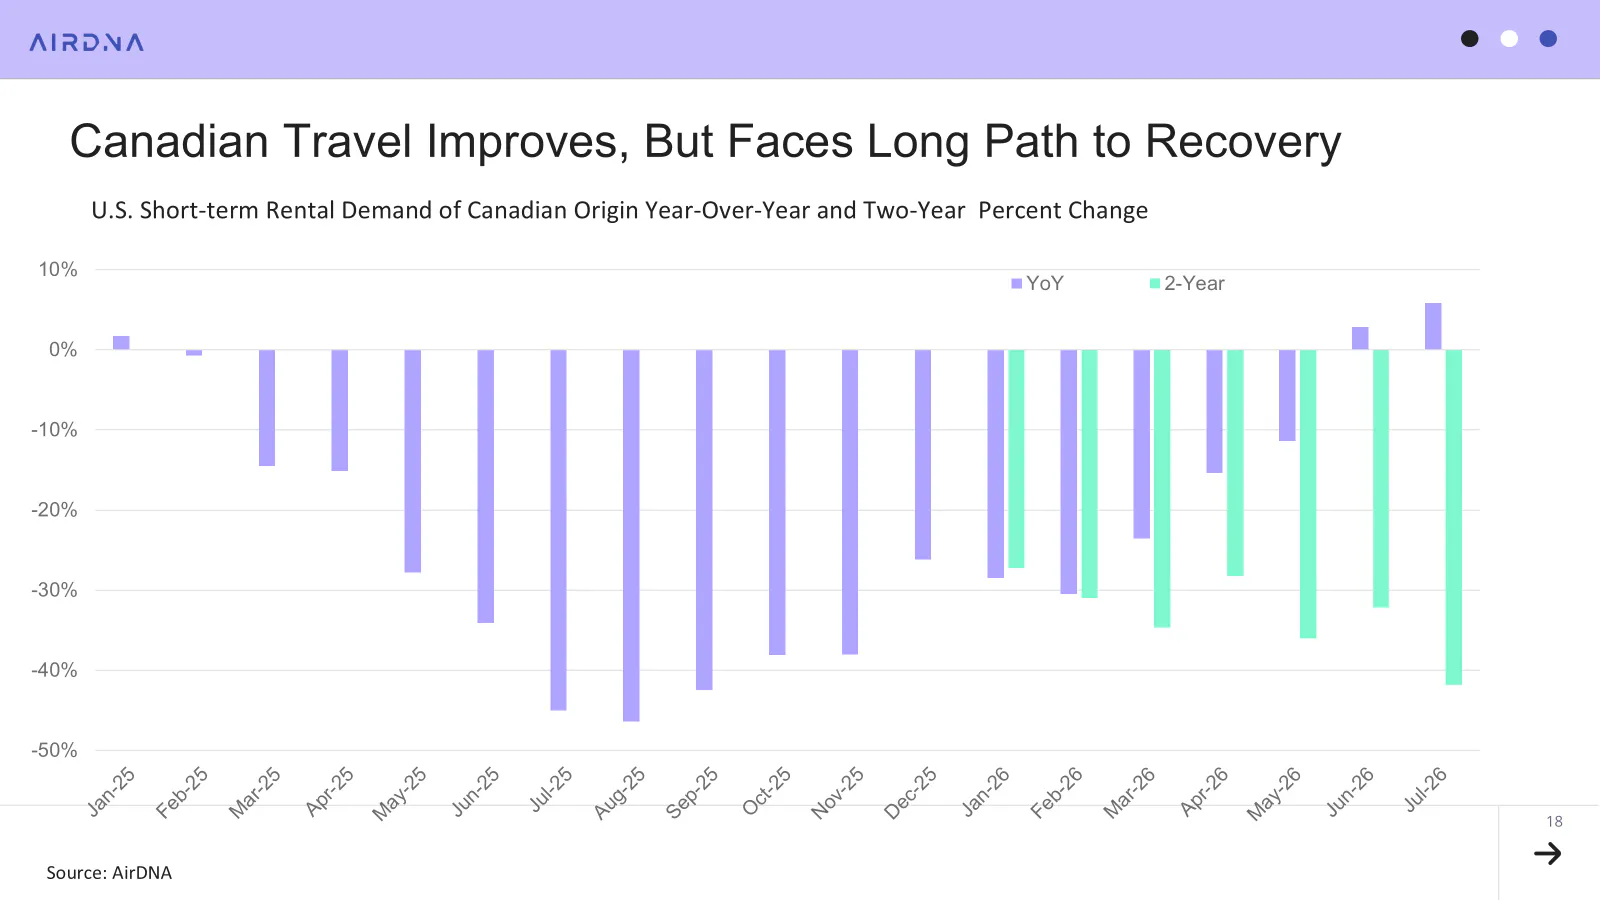
Still, it appears that international demand has stopped its decline. Canada has seen the largest declines so far, but demand improved YoY at an accelerating pace during the World Cup. June improved 2.9%, while July was up 5.8%. Although impressive numbers on their own, they reflect changes from significantly reduced levels compared to two years prior, before the tariff announcements had been finalized. Compared to two years prior, July demand from Canada was still down 41.8%, quantifying the long road back to previous levels of Canadian guest demand.
ARTICLE SUMMARY
The U.S. short-term rental market gained momentum in July, with ADR growth accelerating across almost every major market and occupancy edging higher. World Cup cities continued to outperform, while stronger demand, slowing supply growth, and positive pacing point to an encouraging second half of 2026.
Bram Gallagher
AirDNA Director of Economics and Forecasting
Bram Gallagher is an Economist at AirDNA, specializing in uncovering insights that drive smarter short-term rental decisions. He put his Ph.D. in Economics from the University of Georgia to work researching and forecasting hotel data with CBRE prior to joining AirDNA, as well as teaching economics at a number of universities. In his spare time, Bram enjoys making wooden furniture with hand tools.
