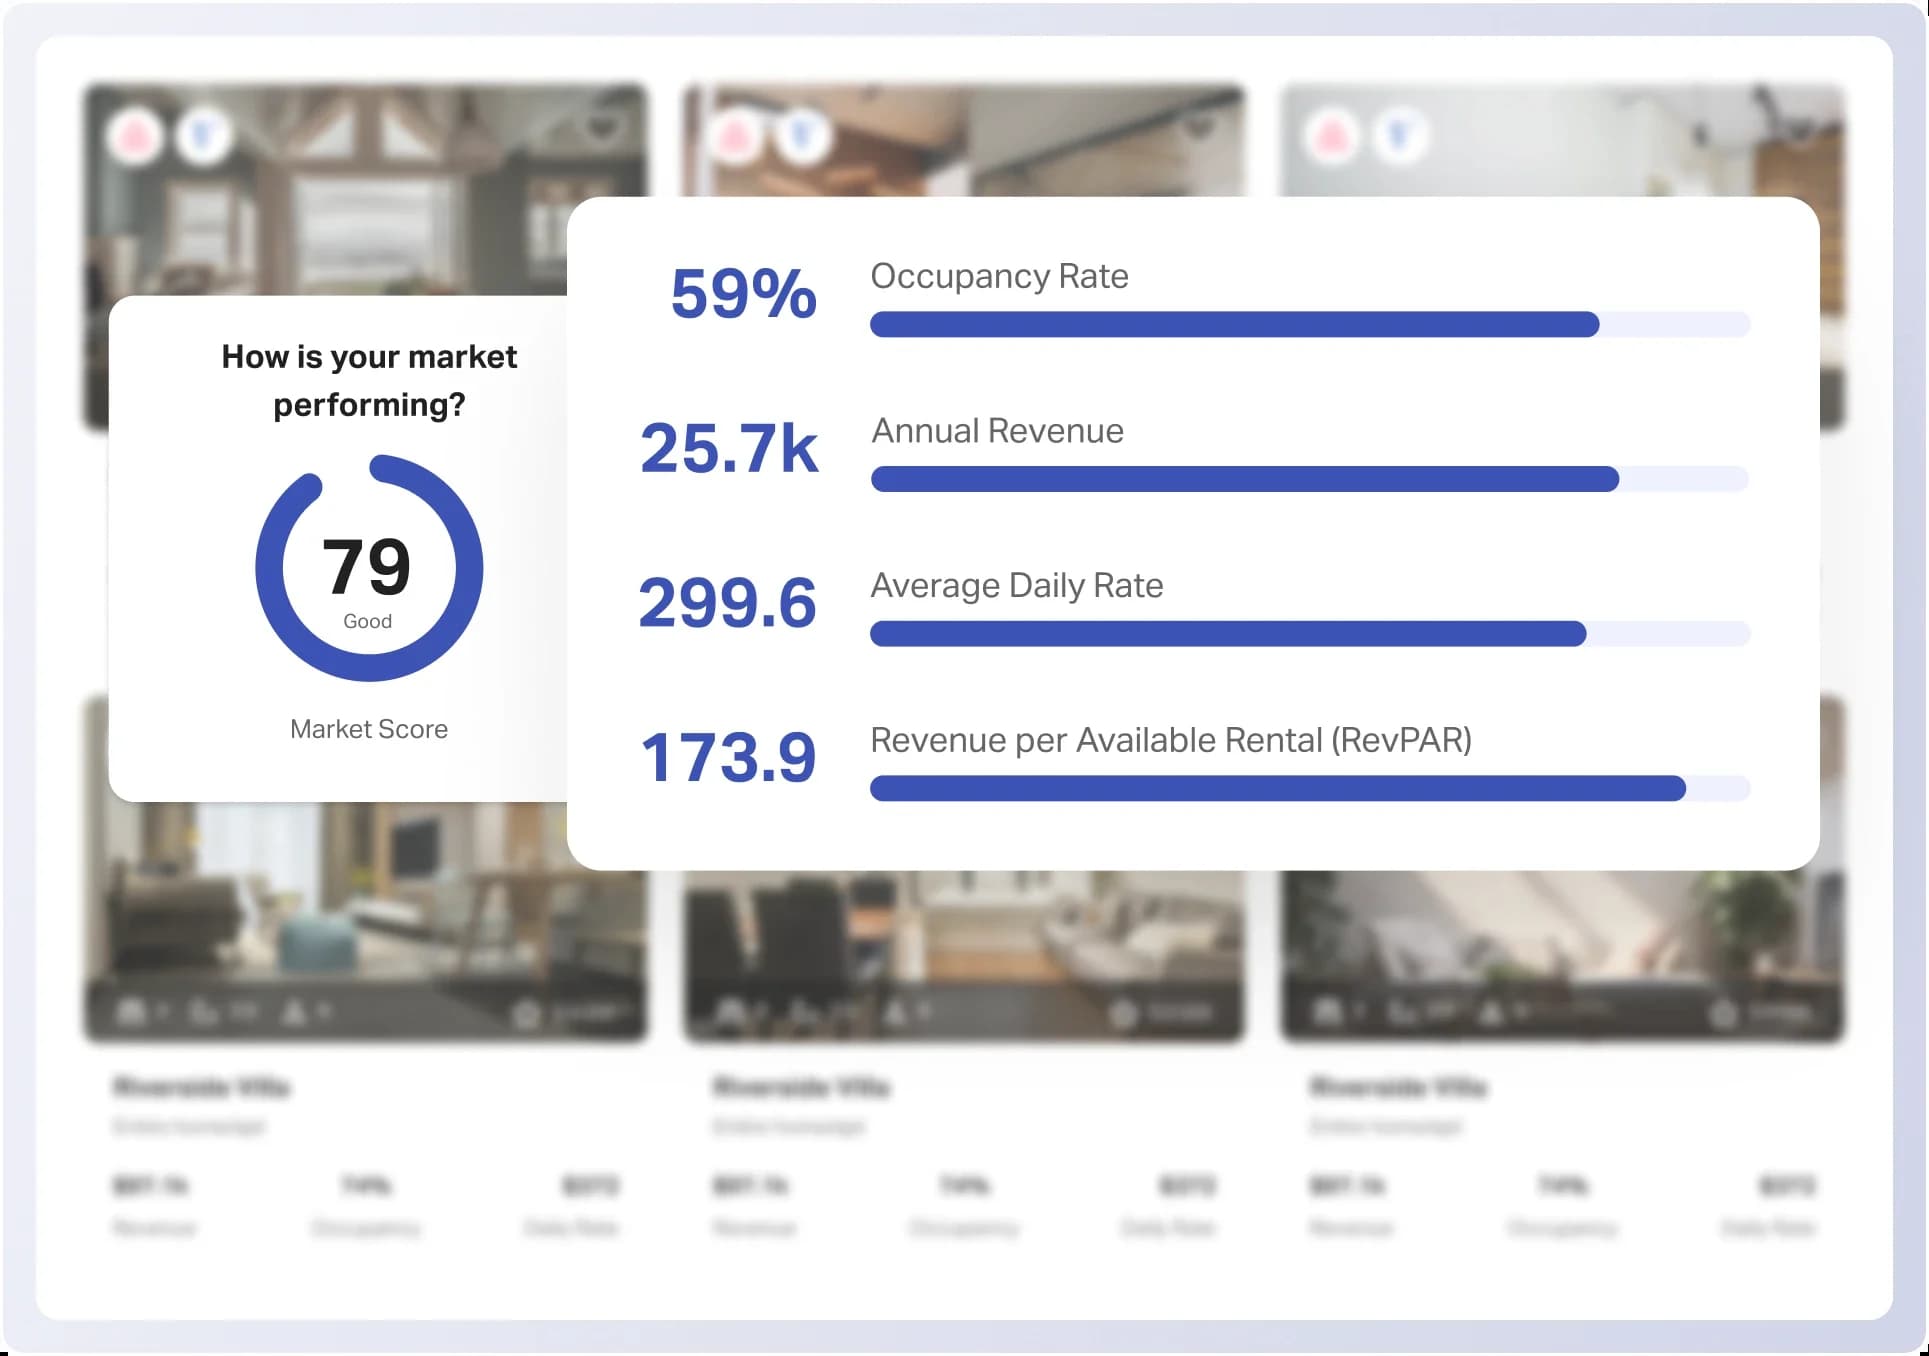
How is Bali performing?
77
Good
68
Rental Demand
55
Revenue Growth
85
Seasonality
70
Regulation
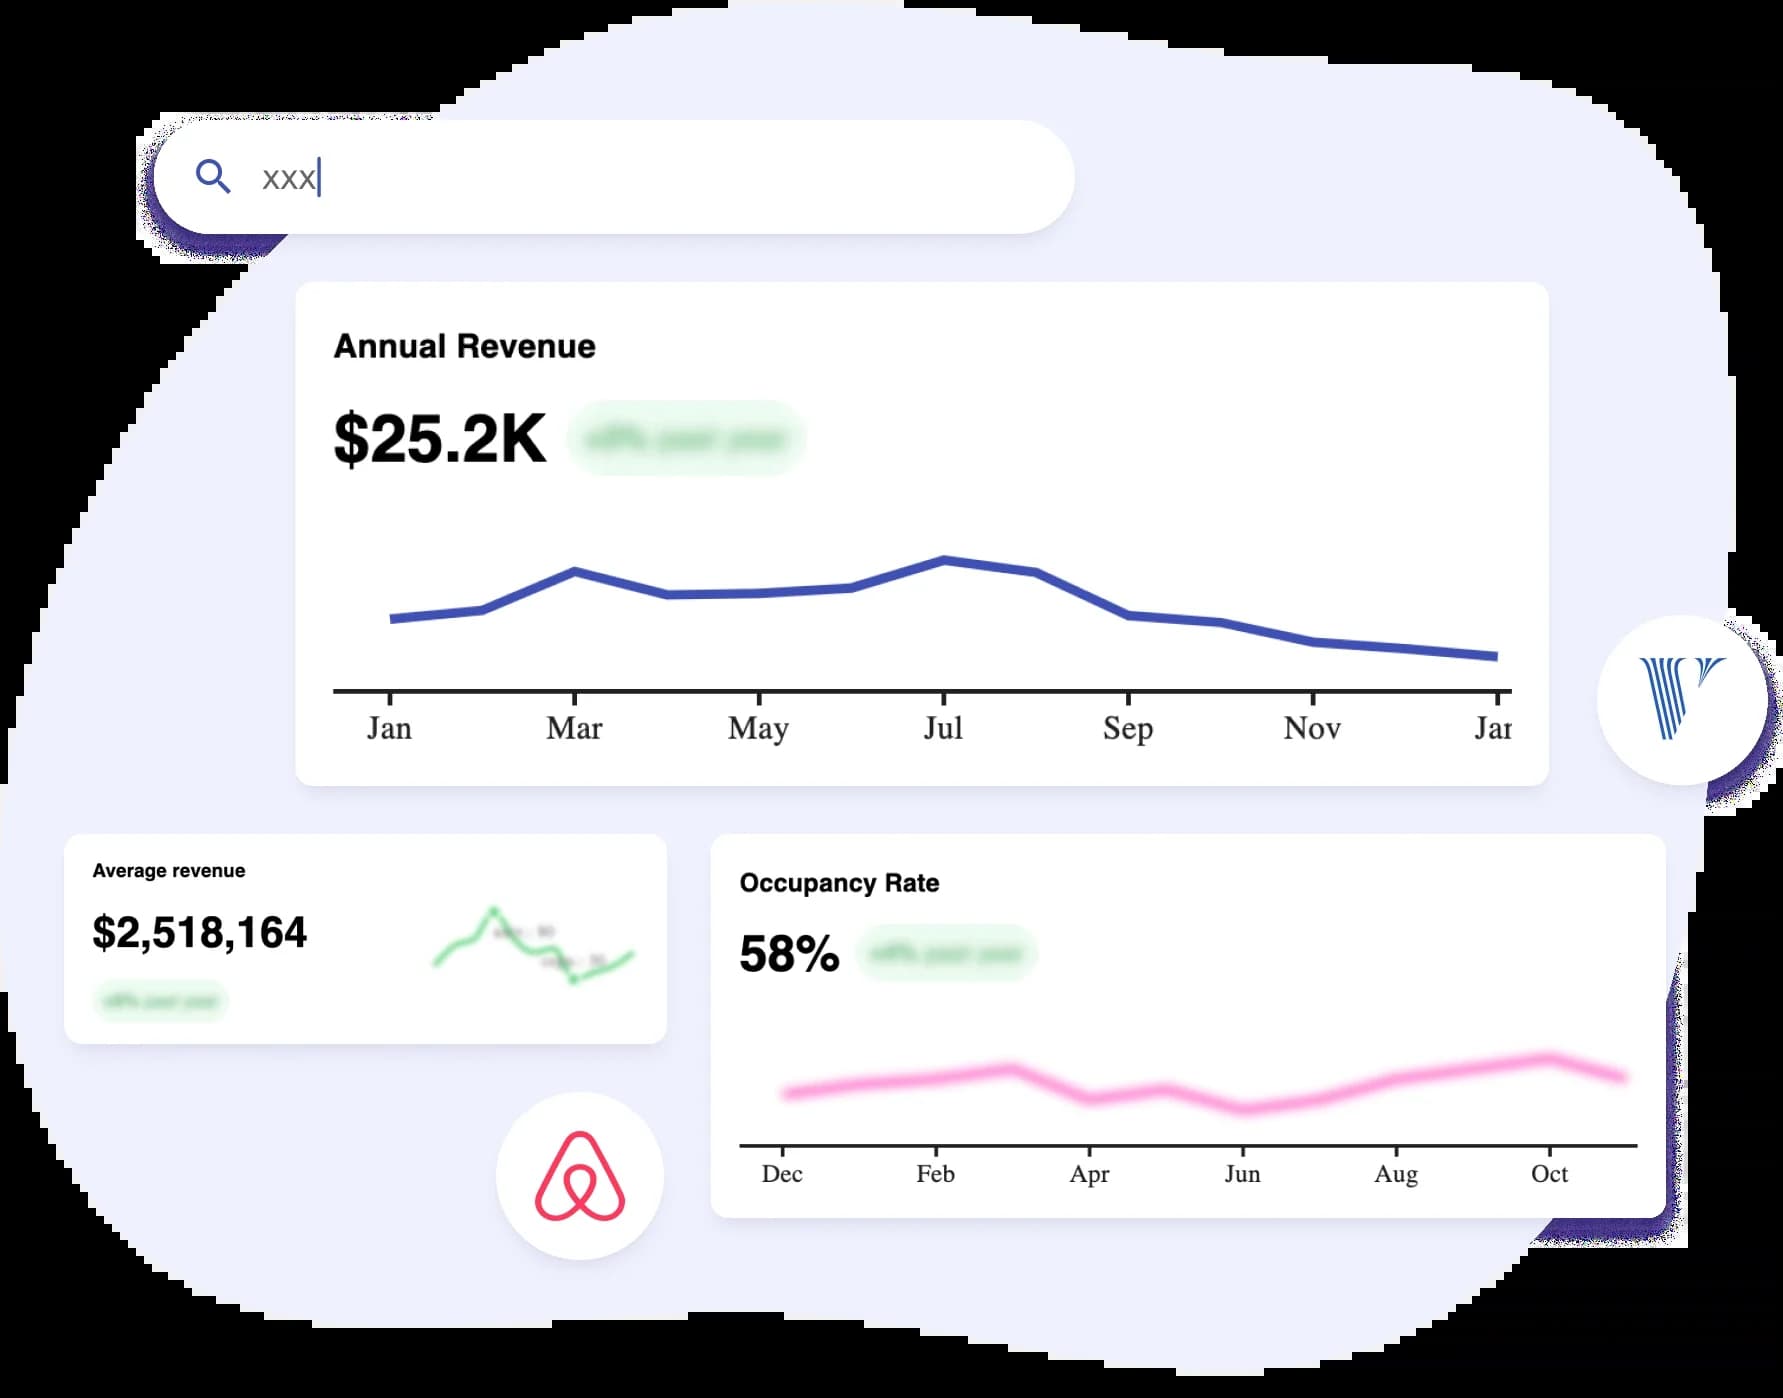
Annual Revenue
$13.5K
+3%
past year
Occupancy Rate
47%
+4%
past year
Average Daily Rate
$145.9
+3%
past year
Revenue per Available Rental (RevPAR)
$65.9
+6%
past year
Bali Performance Details
Total available listings
83,239
+3%
past year
Listings by rental channel
Airbnb (91%)
Vrbo (1%)
Both (8%)
Listings by rental size
1 Bedroom (52%)
2 Bedroom (21%)
3 Bedroom (14%)
4 Bedroom (6%)
5+ Bedroom (7%)
Rental growth in the last 12 months
Active Listings
+8%
past year
Listings by annual availability
1-90 nights (9%)
91-180 nights (11%)
181-270 nights (14%)
271-365 nights (66%)
Listings by rental type
Entire Home (63%)
Private Room (37%)
Shared Room (0%)
Listings by Cancellation Policy
Flexible (38.2%)
Moderate (20.2%)
Strict (37.1%)
Super Strict (4.4%)
Listings by Minimum Stay
1 Night (0.1%)
2 Nights (22.9%)
3 Nights (6.7%)
4-6 Nights (1.8%)
7-29 Nights (1.8%)
30+ Nights (66.6%)
What amenities do listings have?
Internet
99%
Wireless Internet
99%
Aircon
96%
Parking
88%
Pool
83%
Who are the largest property managers?
| Property Manager | Listings | Annual Change | Reviews | Average Review |
|---|---|---|---|---|
Bali Accomodation | 1374 | 0.1% | 411 | 4.30 |
Bali Hospitality | 1302 | 0.2% | 134 | 4.28 |
Host - Patchi | 1227 | 0.2% | 52 | 4.17 |
De La Vie | 1174 | -0.7% | 73 | 4.32 |
Bali Superhost Management | 553 | 0.4% | 22809 | 4.82 |
Excellent

4.8(687 reviews)
“Gave me the visibility to make researched decisions on properties. The amount of data I was able to retrieve allowed me to make more educational decisions. Would recommend to anyone looking into STR.”
Bali Occupancy Data
Occupancy Rate
47%
+5%
past year
Booking lead time
Register to see moreLength of stay
Register to see moreWhat percentage of the month was occupied?
Average monthly occupancy over the last 5 years
+3%
past year
2023
2022
2021
2020
2019
2018
Bali STR Revenue Data
Average revenue
$1,345,581
+5%
past year
Entire place
Register to see moreHouse
Register to see moreApartment
Register to see moreHow much revenue did listings earn per month?
Average revenue over the last 5 years
+3%
past year
2023
2022
2021
2020
2019
2018
Rates
Revenue per available rental (RevPAR)
$47
+5%
past year
Revenue per available rental
Register to see moreRevenue per available rental (RevPAR) over the last 5 years
Register to see moreWhat was the average daily rate?
Average daily rate over the last 5 years
-3%
past year
2023
2022
2021
2020
2019
2018
Data trusted by

Grow your business with the expert insights and advice
Dive into a wealth of knowledge designed to empower hosts and investors. Our comprehensive resources include:

Guides & tutorials
Step-by-step instructions to maximize your STR investments using short-term rental data.

Blog & articles
Stay updated with the latest news, trends, and tips in the short-term rental industry.

Webinars
Learn from industry experts and stay ahead of market trends with short-term rental analytics.
The STR Data Lab Podcast
Get weekly insights from Chief Economist Jamie Lane on all things short-term rentals
Smart Investments Happen Here
AirDNA’s powerful yet easy-to-use tools make hosting and investing a breeze.
This means having every insight you need, all in one place, always up-to-date.
Start exploring for free